使用LaTeX绘制各种科研图,示意图等。
代码和效果
1 | \documentclass[border = 0.2cm, 12pt]{standalone} |
解释
基础部分
文档设置部分: standalone 是一个特殊的LaTeX文档类,他会自动把输出的PDF建材到刚好包含内容的大小,十分适合绘图。
设置border表示内容周围添加的边距,12pt表示字体大小。
绘图部分
绘图环境使用tikzpicture
scale表示绘图比例,基本单位是1cm,scale=2.5表示绘图比例为2.5,也就是说绘图中的1cm的输出实际是2.5cm。
>=latex表示箭头为latex风格。常见的箭头样式:
1 | \tikzset{>=latex} % LaTeX 风格箭头(最常用) |
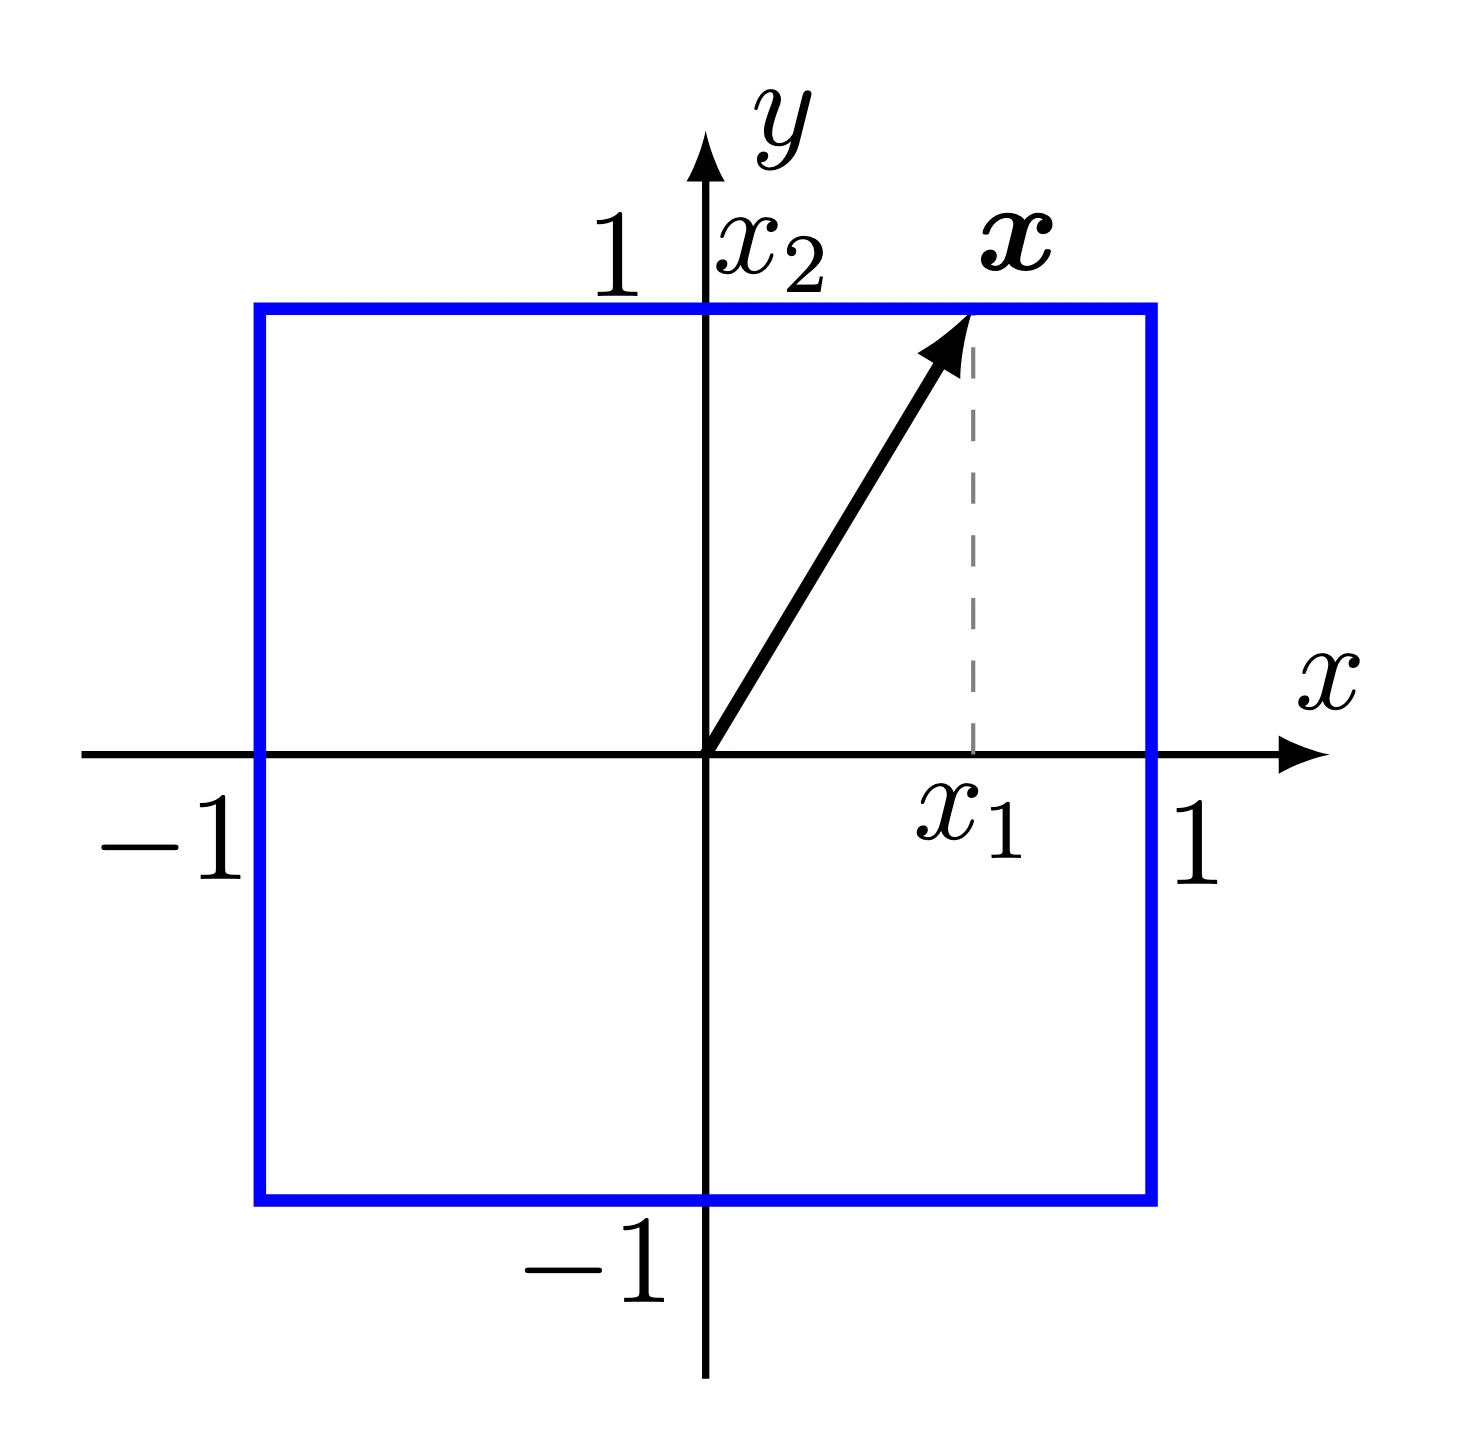
绘制坐标轴
1 | \draw[->,line width=0.7] (-1.4,0)--(1.4,0) node[above]{$x$}; |
以绘制$x$轴为例,(-1.4,0)表示起点,(1.4,0)表示终点,line width=0.7表示线宽,node[above]{$x$}表示在终点上方添加$x$标签。
这里关键的就在于node命令,如果要在下方添加标签,可以这样写:
1 | draw[->,line width=0.7] (-1.4,0)--(1.4,0) node[below]{$x$}; |
TikZ 中的位置关键字可以组合使用,常见的位置选项包括:
- below - 下方
- left - 左边
- right - 右边
- above - 上方
- below left - 左下
- below right - 右下
- above left - 左上
- above right - 右上
也可以使用精确数值控制:
1 | \draw[->,line width=0.7] (-1.4,0)--(1.4,0) node[below=0.2cm]{$x$}; |
或者像后文一样,使用node at命令:
1 | \node at (0.6,-0.15) {$x_1$}; |
绘制项链和辅助线:
1 | \draw[arrows=->, line width=1.2] (0,0)--(0.6,1); |
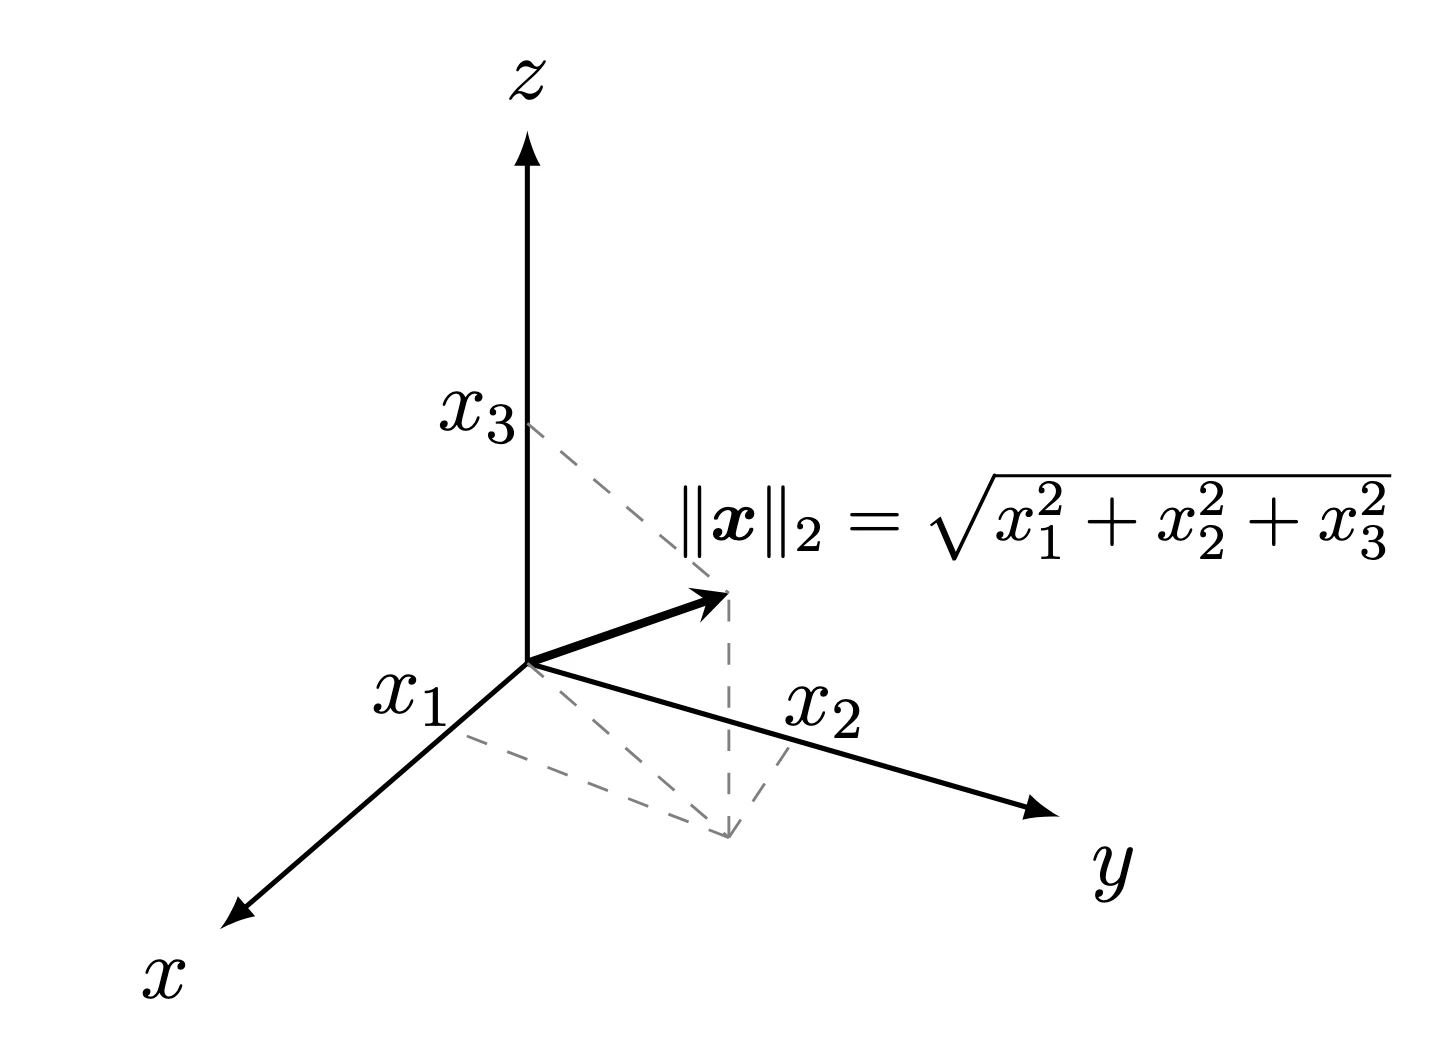
3D坐标
使用tikz-3dplot包,可以绘制3D坐标系。
1 | \tdplotsetmaincoords{60}{120} |
其中,tdplot_main_coords定义了3D坐标系的主视角,axis定义了坐标轴的样式,vector定义了向量的样式,vector guide定义了向量辅助线的样式,具体:
1 | [scale=3, % 将整个图形放大3倍 |
tdplotsetcoord使用的是球坐标系,P表示点,.8表示半径,55表示俯仰角,60表示偏航角。
其他的内容和2D坐标系类似。
效果: